
Oracle Linux Basic Administration Series - Part 7 - How to Monitor System Performance in Oracle Linux
- Jason Beattie
- Nov 11, 2025
- 2 min read
Monitoring system performance is one of the key responsibilities of a Linux administrator.It helps you understand how your server is performing, detect bottlenecks, and troubleshoot issues before they become serious problems.
In this blog, you’ll learn how to use essential command-line tools to monitor CPU, memory, disk, and process activity on Oracle Linux.
Step 1: Check System Uptime and Load
To quickly see how long your system has been running and how busy it is:
uptimeExample output:

load average → system load in the last 1, 5, and 15 minutes.A load value near the number of CPU cores means your system is busy but stable.
Step 2: View Real-Time System Stats with top
top gives you a live view of system activity.
Run:
topKey sections:
Tasks: number of running and sleeping processes
%Cpu(s): CPU utilization by user/system/idle time
KiB Mem: memory usage
COMMAND: list of processes using the most resources
Quit with q.

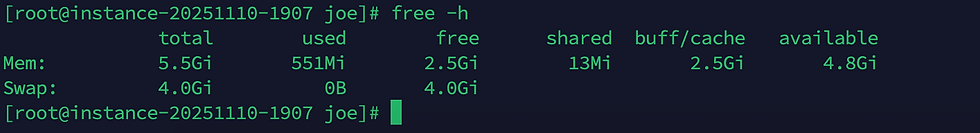
Step 3: Check Memory Usage with free
To check memory and swap usage:
free -hOutput:
Step 4: View CPU and I/O Statistics with vmstat
vmstat (Virtual Memory Statistics) provides an overview of CPU, memory, and process usage.
Example:

This shows updates every 5 seconds, five times.
Columns:
r: running processes
b: blocked processes
us: user CPU time
sy: system CPU time
id: idle time
wa: I/O wait
Step 6: Monitor Disk Usage and Space
View overall disk space:
df -h
Check directory size:
du -sh /var/log
List top 10 largest files/directories:
sudo du -ah / | sort -rh | head -n 10Step 7: Monitor Disk I/O with iostat
To install and use iostat:
sudo dnf install -y sysstat
iostat -xz 5
Key columns:
tps → transactions per second
kB_read/s, kB_wrtn/s → read/write speed
%util → how busy the disk is (over 80% may indicate I/O bottleneck)

Step 8: Monitor Network Activity
Check network interface statistics:
ip -s link
Step 9: Check System Logs
Logs are essential for troubleshooting performance issues.
View system logs:
sudo journalctl -xe
Check boot logs:
sudo dmesg | less
Step 10: Monitor System Performance Over Time with sar
sar collects, reports, and saves performance data. It’s part of the sysstat package.
To start data collection:
sudo systemctl enable --now sysstat
Check CPU usage history:
sar -u 5 3
Check memory usage:
sar -r 5 3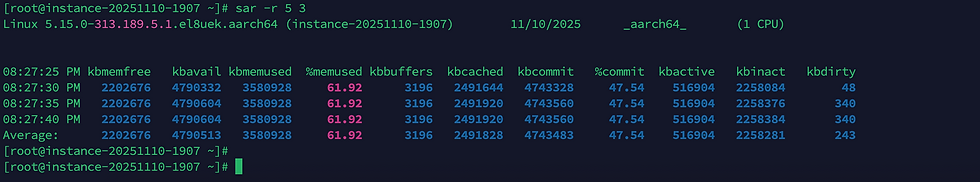
Conclusion
You’ve now learned how to monitor system performance and resources in Oracle Linux using both built-in and enhanced tools.
These commands are your first line of defense in diagnosing system slowness or resource issues.
Next, we’ll move into disk management - learning how to create, format, and mount partitions and file systems.


Comments